
Inside the WhiteOwl Networks Data Pipeline
Modern network observability, built for scale and simplicity
WhiteOwl Networks is designed to deliver deep network visibility without the operational burden traditionally associated with monitoring platforms. The architecture is modular, scalable, and automation-first — built to deploy quickly, adapt easily, and grow with your network. A big part of this pipeline is how we leverage Clickhouse for network visibility
This post provides a high-level look at how telemetry flows through the WhiteOwl platform, from devices to insights.
Unified Telemetry, One Pipeline
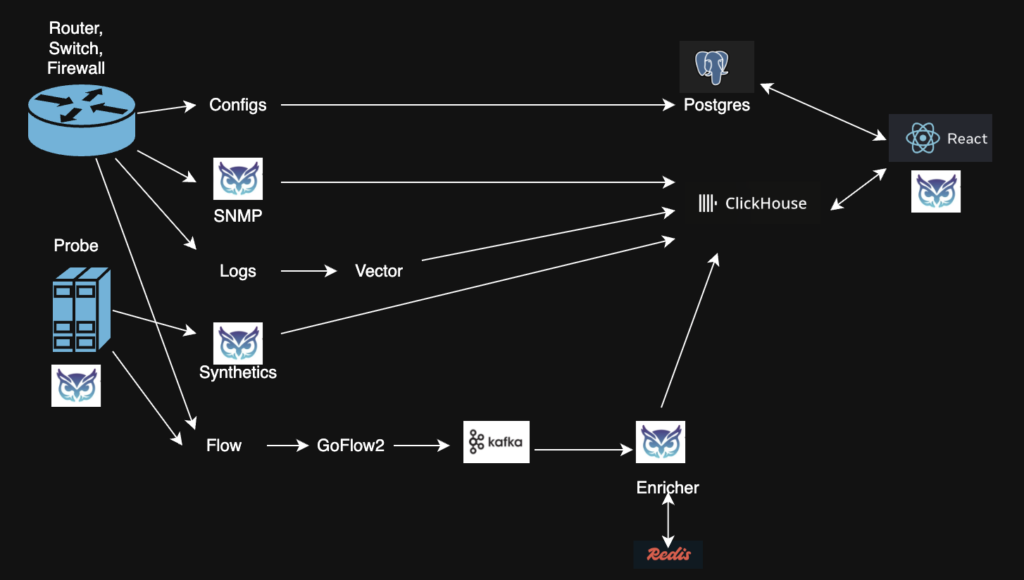
WhiteOwl brings together metrics, flow, logs, synthetics, and configurations into a single, coherent data pipeline. Each component is purpose-built, loosely coupled, and optimized for real-world enterprise environments.
At every stage, automation is a first-class citizen.
Data Collection & Automation
Network Devices & Probes
WhiteOwl collects telemetry directly from:
- Routers and switches
- Physical and virtual probes
- Cloud environments (including AWS VPC Flow Logs)
SNMP Auto-Discovery & Polling (Go)
A high-performance, Go-based service continuously:
- Discovers devices
- Builds topology using LLDP
- Collects CPU, memory, and interface statistics
No manual inventory management required.
Flow Ingest (goflow2)
Flow telemetry (NetFlow, IPFIX, sFlow) is received by goflow2, normalized, and streamed downstream as protobuf messages — enabling high-volume, low-latency processing.
Log Ingest (Vector)
Logs are ingested using Vector, providing reliable, structured log collection at scale.
Configuration & Deployment Automation (Ansible)
Automation doesn’t stop at visibility.
WhiteOwl uses Ansible to:
- Deploy and update probes
- Manage device configurations
- Standardize configuration workflows
- Enable repeatable, auditable changes
This ensures consistency across environments while reducing manual effort and risk.
Streaming, Enrichment & Context
Kafka – The Streaming Backbone
Kafka serves as the central streaming layer for flow-related telemetry, decoupling ingestion from processing and allowing the platform to scale independently at each stage.
Enrichment Service (Go)
Before data is stored, it is enriched with operational context:
- Reverse DNS resolution
- Tagging driven by UI configuration (apps, environments, owners, business units)
A Redis cache accelerates lookups and minimizes latency, ensuring enrichment keeps pace with high-ingest environments.
Purpose-Built Storage
WhiteOwl stores data where it performs best:
- ClickHouse
- SNMP metrics
- Flow data
- Logs
- Synthetics
High-speed ingestion and sub-second analytics at scale.
- PostgreSQL
- Device configurations
- UI configuration
- Integrations and metadata
This separation keeps analytics fast while preserving transactional integrity.
Customer Experience
All insights are delivered through a React-based UI, providing:
- Unified visibility across all telemetry types
- Fast, interactive analytics
- Tag-driven filtering and correlation
- Configuration-driven enrichment and integrations
The UI is not just a dashboard — it’s the control plane for the entire platform.
Simplified Deployment
WhiteOwl is:
- Fully containerized (Docker)
- Deployed via a simple script
- Lightweight and production-ready
- Ideal for POCs, labs, and enterprise rollouts
No Kubernetes required. No unnecessary complexity.
High-Level Architecture Diagram
Why This Architecture Works
WhiteOwl Networks is built to:
- Scale with high-throughput networks
- Add context early so data is immediately useful
- Automate deployment and configuration
- Stay operationally simple
It’s observability designed by people who have run large networks — not just drawn diagrams.
If you’re interested in trying WhiteOwl Networks or collaborating as an early user, we’d love to hear from you.