
What Is a Network Packet Probe? Deep Packet Visibility for Modern Monitoring: Deploy, Standardize, and Observe with WhiteOwl Networks
Network visibility is only as good as the data you collect—and collecting that data shouldn’t require weeks of manual configuration, custom scripts, or fragile one-off deployments.
WhiteOwl Networks was designed to make probe deployment and operations as simple as visibility itself. From a single UI, teams can deploy probes, standardize configurations, and immediately begin collecting enriched flow data, performance metrics, and synthetic test results—all without leaving the platform.
Probe Deployment Directly from the UI
WhiteOwl probes are deployed directly from the WhiteOwl UI, eliminating the need for separate automation tools or manual installs.
Using built-in Ansible automation, operators can:
- Add target hosts by IP or hostname
- Apply standardized configuration templates
- Deploy probes consistently across environments
To get started, simply provide:
- SSH credentials or
- A PEM key
WhiteOwl handles the rest.
This approach ensures every probe is deployed the same way, reducing configuration drift and operational risk.
Built-In Ansible for Consistent, Repeatable Deployments
WhiteOwl includes Ansible natively—no external automation required.
With Ansible-backed templates, teams can:
- Enforce consistent probe configurations
- Standardize data collection across sites
- Update or redeploy probes safely at scale
- Eliminate snowflake deployments
Whether deploying one probe or hundreds, configuration consistency is built in from day one.
More Than a Probe: A Distributed Network Sensor
Once deployed, the WhiteOwl probe can perform multiple roles from a single lightweight footprint:
- Packet conversion to IPFIX
- SNMP collection
- Traceroute execution
- Synthetic testing
- Secure remote connectivity
- DPI (Applications and Category identification)
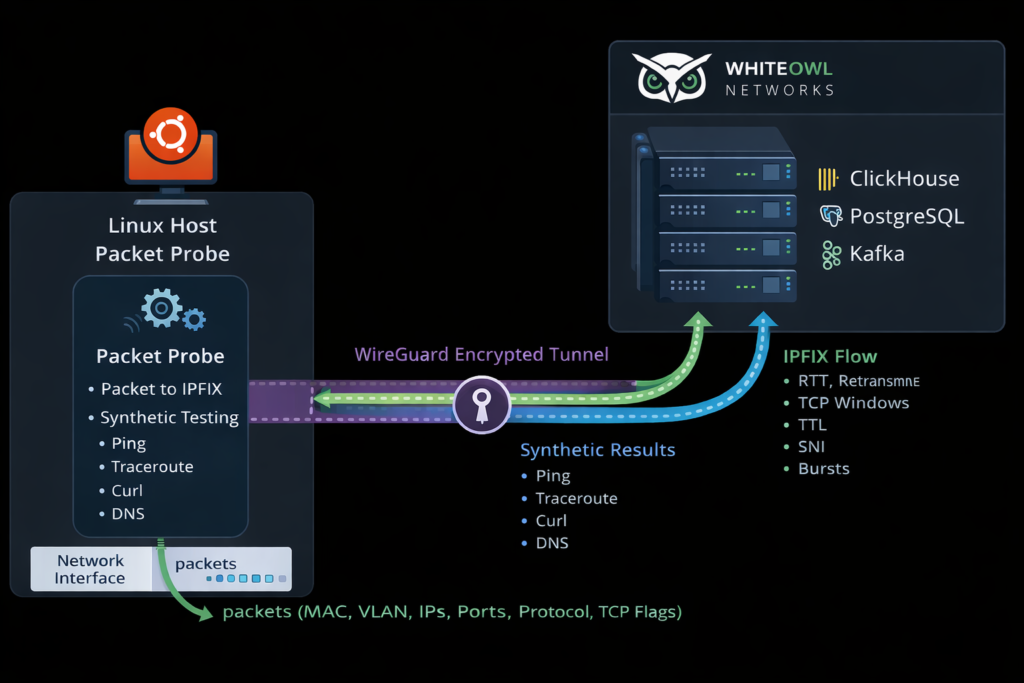
For remote or untrusted environments, WhiteOwl can automatically deploy WireGuard, encrypting telemetry between the probe and the platform without additional configuration.
Packet to IPFIX: Standard Flow Plus Deep TCP Performance
When packet-to-IPFIX conversion is enabled, the probe exports standard flow fields, including:
- MAC addresses
- VLAN IDs
- Source and destination IPs
- Source and destination ports
- Protocol
- TCP flags
- Interface IDs
In addition to these standard fields, WhiteOwl enriches flows with TCP Performance Metrics
The WhiteOwl probe exports the following TCP and session-level fields:
- tcp_flags – Visibility into session state and behavior
- min_rtt_us / max_rtt_us / avg_rtt_us – Round-trip time measurements for latency analysis
- retransmit_count – Identifies packet loss and congestion issues
- min_tcp_window / max_tcp_window – Insight into sender and receiver flow control
- min_ttl / max_ttl – Helps identify routing changes or asymmetric paths
- sni – Server Name Indication for application-level visibility in encrypted traffic
- src_hostname / dst_hostname – Host-level context for faster troubleshooting
- max_bytes_per_window – Detects throughput constraints and congestion events
- max_packets_per_window – Highlights bursty traffic patterns
- burst_window_ms – Microburst detection, exposing short-duration spikes often missed by polling-based tools
This provides packet-level insight delivered at flow scale—without the operational burden of full packet capture.
Distributed Synthetic Testing from the Same Probe
Visibility isn’t complete without active testing. From the same deployed probe, WhiteOwl can perform synthetic transactions, including:
- Ping – Latency and reachability
- Traceroute – Path analysis and routing changes
- Curl – Application and HTTP response testing
- DNS response testing – Resolution time and availability
Synthetic tests can be run from centralized locations or remote sites, allowing teams to measure performance exactly where users connect.
All synthetic results are correlated with flows, TCP performance, SNMP data, and logs in the same platform.
Secure by Design, Simple by Default
For remote deployments where encryption is required, WhiteOwl automatically deploys WireGuard alongside the probe. This ensures:
- Secure telemetry transport
- Minimal configuration effort
- No external VPN dependencies
Security is built in, not bolted on.
One Deployment, Many Capabilities
With WhiteOwl Networks, deploying a probe means deploying a full network observability node:
- Passive flow and TCP performance monitoring
- Active synthetic testing
- SNMP and path visibility
- Secure, standardized, repeatable operations
All managed from a single UI. All correlated in a single pane of glass.